February 27, 2017
Monitor the pulse of your seasonal business
BY MARK BRADLEY
 Tracking the progress of a landscape business is trickier than many others. The landscape industry is highly seasonal. Winters are unpredictable. Some companies earn no revenue at all during the winter. Then, in spring, sales boom. You’re signing jobs, cashing deposits — only then to hit the dog days of summer and watch things slow again.
It can be stressful and challenging to know if you’re on track, falling behind, or poised for your best year ever. Sure, you get a gut feeling, but do you really know? And are your expenses keeping pace with your revenue, or outpacing it?
Budgeting and monitoring a seasonal business, like ours, isn’t like many businesses where you can take your sales goal, divide by 12 and come up with monthly targets. But you can take measures to better predict success, and reduce stress, by spending a half-day gathering some history. With a few years of accounting data, you can develop trendlines that take the pulse of your company to ensure you’re on track — or to see problems while you still have time to fix them.
Although we can take the pulse of a lot of numbers, we’ve got just enough space in this article to discuss two of the most important pulse-points to measure:
- Whether you’re on track to hit your end-of-year sales goal, and
- Whether field productivity is improving, holding steady, or falling off.
Tracking sales goals
One of the most important, and simplest, numbers to watch is your sales goal. With a few years of sales history, you can build a benchmarking spreadsheet that will help you know if you’re on track.Start with a spreadsheet like the one below.
Use your accounting software to pull a sales history by month for last year, two years ago, and three years ago. Next, enter your cumulative sales by month in the cells. By cumulative, I mean each month should equal its sales, plus the total of all months prior. (If Jan. sales were $50K, Feb. sales were $60K and March sales were $100K, your spreadsheet should show $50K in Jan., $110K in Feb. and $210K in March.)
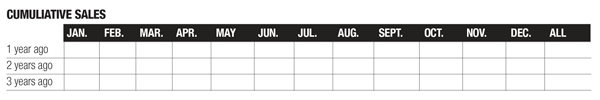
Next, copy that table, but instead of sales by month use a formula to calculate each month’s (cumulative) sales divided by the total sales for that year. This will show you, historically, what percentage of your total sales you have earned by the end of each calendar year. (e.g. Jan. 5 per cent, Feb. 11 per cent, March 21 per cent, etc.) If you’ve done it right, each year will hit 100 per cent (your total sales) by the end of December.
Take an average of the last three years and you will know that — over history — you should have sold X per cent of your sales goal by the end of Jan., Y per cent by the end of Feb., Z per cent by the end of March, and so on.
If we know we average 35 per cent of our revenue by the end of April, then at the end of this April, we want to ensure we’ve sold 35 per cent of our sales goal for the year. If we haven’t, we know we need to get caught up!
Monitoring field productivity
Nothing will make (or hurt) profit quite like field productivity, so it’s a critical number to watch. You can ‘guess’ at staff productivity by seeing how fast they get out of the yard, or seeing jobs being completed on time, but the numbers can tell you a more accurate story without any guessing. Here’s how we can monitor the pulse of your productivity.If you’ve read other articles I’ve written, you’ll know I advocate your accounting should separate your field labour payroll from your overhead payroll expenses into different accounts. It allows us to quickly identify how much wages we’ve paid our crews — and it makes the following kind of management much faster and easier.
Use the same spreadsheet you used above. This time, you enter your total field wages (no overhead staff), cumulatively by month. You’re doing exactly what you did for sales, but this time you’re entering wages for your field staff. By the time you hit Dec., that number should equal your total field payroll for that year.
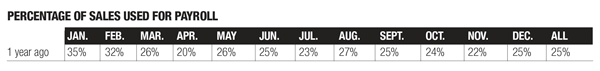
Just like the previous example, copy this table again, but this time, use a formula to divide last January’s field payroll by last January’s sales. This way, I’m going to see what percent of Jan. sales were spent on field staff payroll. Same for February, except February is going to show you the cumulative total of Jan. and Feb. payroll, divided by the total of Jan. and Feb. sales. Repeat this for the entire year. Then repeat for two years ago and again for three years ago.
Unlike the cumulative sales table, these percentages won’t (and shouldn’t) add up to 100 per cent by December (you should never be spending 100 per cent of sales on payroll!). Instead, they might look something like the above chart.
This shows you something you already know… but with hard numbers. In January, you likely have more unbillable time, maybe giving the crews some hours around the shop to give them some income. So you spend a higher percentage of your sales on wages. By April, that percentage has dropped dramatically, as you’ve now invoiced a bunch of work (deposits, etc.) on jobs you haven’t spent a lot of hours on yet. That percentage climbs back up in May when crews are pulling a lot of hours getting out of the gates, then it starts to normalize again as the year goes on.
Now simply average each month over your last three years to see the average amount of sales you spend on wages by the end of each month.
This exercise will help you shine a spotlight on your productivity. Referring to my example above, if you’re at 24 per cent by the end of this May, you are more productive and efficient than normal (you are spending LESS of your total sales on wages). If you find yourself at 30 per cent at the end of this May, you are not as productive/efficient as years past, and you need to start spotting and fixing those inefficiencies now, before it is too late.
Mark Bradley is president of TBG Landscape and LMN, based in Ontario.